Visualizing Molecules#
In this tutorial we will cover:
how we can visualize our structures in 3D
how we can highlight specific parts of molecules
how we can export visualizations
how we can visualize structures in 2D
how we can customize 2D visualizations
When building a molecule we need to know which parts to connect to each other. This involves defining linkages where we specify which atoms to connect to each other. How do we know what the atoms are called or what serial numbers they have? Unless we are working with pre-defined linkages and compounds that we trust, we usually don’t! The solution is to look at the structure and get the info for ourselves. Also, what if we find the built structure to be a little “crammed” or have a clash
somewhere. We can optimize the conformation and the best way to check that the optimization was successful is again to look at the result directly. There are many reasons for us to visually inspect structures. This is why BuildAMol molecules have two methods show and draw that will visualize the structures in 3D.
Plotting backends#
BuildAMol uses plotly as backend to visualize structures. Plotly can handle large plots pretty well even in 3D but it may get overwhelmed if you overlay too many layers! Especially when overlaying different conformations plots can get really large really quickly - 50 conformations of a 200 atom molecule on top of each other is getting difficult to handle! As an alternative, BuildAMol also integrates nglview and py3dmol to visualize a molecular structure. In this case no further
highlighting functionality is offered, however. There is a correspondignly named method in the Molecule class to open an nglview window instead of a plotly figure.
We can set the default backend for visualization using
import buildamol as bam
bam.visual.set_backend("plotly") # (default)
bam.visual.set_backend("py3dmol")
bam.visual.set_backend("nglview")
The backend will be used by the Molecule.draw and Molecule.show methods to create visualizations. Specific methods for each backend are also available: Molecule.plotly, Molecule.py3dmol, and Molecule.nglview, which operate at the “drawing” level and return an object that can be further manipulated before ultimatelly rendering using their own show method.
Let us visualize and highlight parts in a larger molecule.
[1]:
import plotly
plotly.offline.init_notebook_mode()
[2]:
import buildamol as bam
mol = bam.Molecule.from_json("files/x_wing.json")
# let's start with a barebone "show"
# which by default will use plotly as backend
mol.show()
We can also manually force another visualization using:
[3]:
mol.py3dmol().show()
3Dmol.js failed to load for some reason. Please check your browser console for error messages.
Or we set another default backend like so:
[4]:
bam.visual.set_backend("py3dmol")
mol.show()
3Dmol.js failed to load for some reason. Please check your browser console for error messages.
Customizing Plotly Visualizations#
Next we can try figuring out what features are offered to “highlight” parts of molecules in the MoleculeViewer3D object. To do that we first call the plotly method of the molecule and then use the returned viewer object to further highlight stuff. For a start, we could highlight some specific residues:
[5]:
# get the viewer
viewer = mol.plotly(atoms=False)
# highlight the two residues named TRZ in orange and red, respectively
viewer.highlight_residues(*mol.get_residues("TRZ"), bond_colors=["orange", "red"], linewidth=1.2)
viewer.show()
Next we might want to highlight a specific atom neighborhood:
[6]:
# get the atom with serial number 49
source_atom = mol.get_atom(49)
# get all neighboring atoms within 4 bonds of the source atom
neighbors = mol.get_neighbors(source_atom, 4)
# highlight the source atom and its neighbors
viewer.draw_atom(source_atom, color="lightblue", id="source-atom")
viewer.draw_atoms(*neighbors, colors="purple", opacity=0.1, showlegend=False)
viewer.show()
We can also more specifically use draw_point or draw_vector to draw any point or edge we like, irrespective of them belonging to an existing atom or not.
[7]:
center = mol.center_of_mass
# let's draw in the overall center of mass of the entire molecule
viewer.draw_point("center-of-mass", center, color="limegreen")
# and now let's visualize the vectors marking the distance between the neighbors and the center of mass
for i in neighbors:
dist = bam.structural.distance_between(i.coord, center)
viewer.draw_vector(
f"{dist=}", i.coord, center, color="yellow", opacity=0.8, linewidth=1, showlegend=False, hoverinfo="name"
)
viewer.show()
If we are happy with our slightly wild figure, we can export it to a stand-alone HTML file that we can save and share with others, using the write_html method. If we want to integrate the figure somewhere else such as a plottly-supporting web-app framework we can always get the underlying plotly.Figure object using the figure attribute of the MoleculeViewer3D.
[8]:
# save the figure to an html file
viewer.write_html("files/x_wing.html")
# get the plotly figure for other purposes
fig = viewer.figure
Visualizing Graphs#
If you have come across the optimization section, you definitely know that each Molecule can be represented by an AtomGraph or a ResidueGraph. Both graphs also support the same show and draw mechanisms, so visualizing them is no different than visualizing the molecule itself. For instance, we can visualize the residue graph representation of the molecule just like this:
[9]:
# get a residue graph
graph = mol.make_residue_graph()
# make a graph viewer
graph_viewer = graph.draw()
# highlight all bonds that are part of the TRZ residues
for residue in mol.get_residues("TRZ"):
graph_viewer.draw_edges(*mol.get_bonds(residue), color="red", opacity=0.3, linewidth=2, showlegend=False)
graph_viewer.show()
Using Py3DMol#
If you prefer NglView or 3DMol.js to the default plotly based figures, you can always call nglview or py3dmol (or draw / show if the backend was set). This is only supported for Molecules, however, and is not implemented for graphs.
[10]:
viewer = mol.py3dmol()
viewer.show()
3Dmol.js failed to load for some reason. Please check your browser console for error messages.
In fact, Py3DMol also supports customization to a certain degree, although not as much as Plotly! You can use the add method of a Py3DMolViewer to add additional layers to a visualization, for instance, we can make a before-after optimization rendering using:
[11]:
opt = mol.optimize(inplace=False)
# add another viewer-layer to the existing viewer
viewer.add(opt.py3dmol(color="green"))
viewer.show()
3Dmol.js failed to load for some reason. Please check your browser console for error messages.
Customizing Py3DMol Visualizations#
The Py3DMolViewer does not offer any additional methods except for add. However, since the method accepts not only full molecules but also other entities such as atoms or residues we can selectively add additional layers to our rendering. For example to highlight atoms close to the center of the molecule we could do the following:
[ ]:
# get atoms close to the center of mass
center = mol.center_of_mass
close_by_atoms = mol.get_atoms(filter=lambda a: bam.structural.distance_between(a.coord, center) < 4)
# create a new viewer for these atoms using a different style
v_close_by_atoms = bam.visual.Py3DmolViewer(list(close_by_atoms), style=dict(sphere=dict(radius=1, color="red", opacity=0.8)))
v = mol.py3dmol()
v += v_close_by_atoms # this is equivalent to v.add(v_close_by_atoms)
v.show()
3Dmol.js failed to load for some reason. Please check your browser console for error messages.
2D drawing#
BuildAMol does not by itself support a 2D visualization of molecules. However, because rdkit implements an excellent 2D visualization scheme 2D graphics of molecules can be easily created by simply first exporting to rdkit. We integrated a chem2dview method to molecules that will perform the necessary conversions automatically, and return a 2D image of the molecule. There is also a draw2d and show2d wrapper, but these do currently simply forward to chem2dview since no
other 2d plotting backends are supported at the moment.
[ ]:
# only works if RDKit is installed
mol.chem2dview().draw()
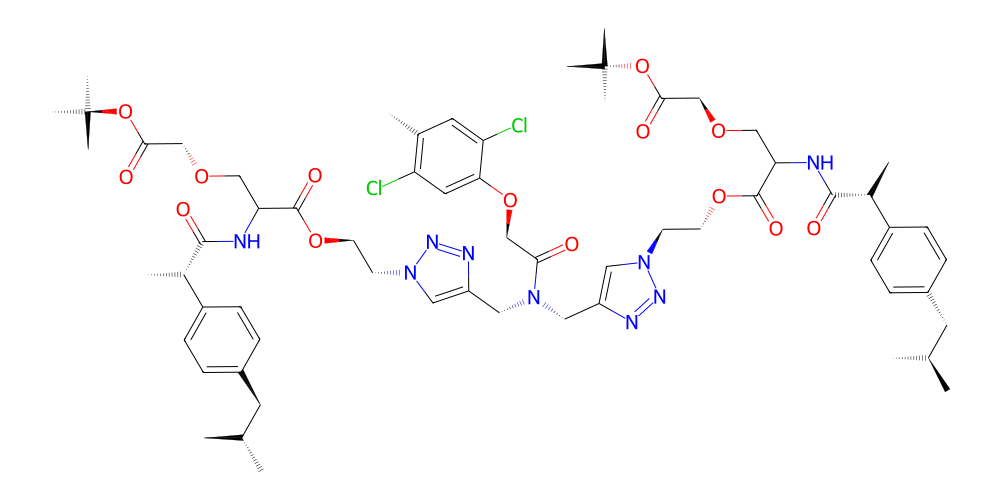
[ ]:
# or
mol.draw2d().draw()

Customizing 2D drawings#
We can adjust the parameters that are used for drawing by passing additional keyword arguments to the chem2dview (or draw2d) method, to adjust things like linewidth, coloring, or the way atoms are shown. To make things simpler the Chem2DViewer class offers the methods set_colors, label_atoms, highlight_atoms, highlight_bonds, and highlight_residues allowing us to selectively edit the the rendering of molecules in 2D.
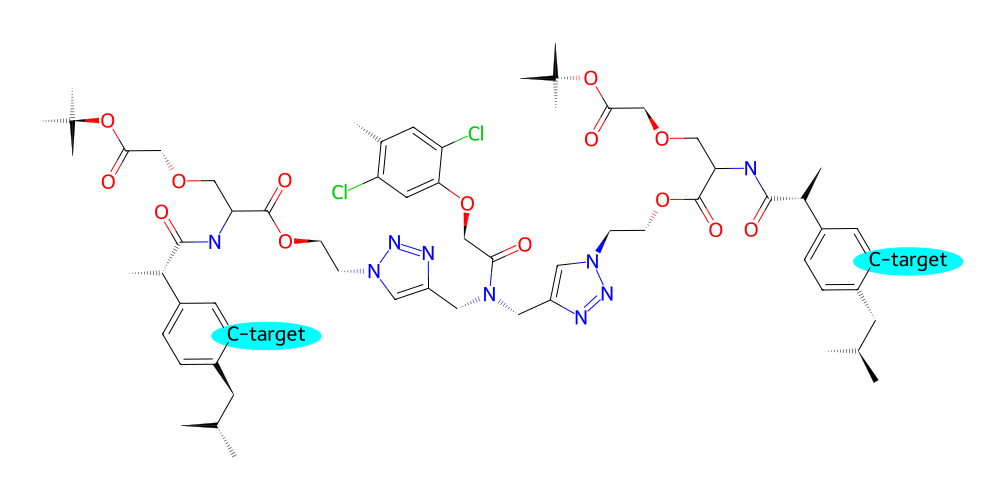
For example if we are planning to screen for suitable functional groups at specific locations in our molecule that will result in desireable properties we might want to label the potential attachment points for functional groups:
[35]:
# specifically label all 'C2' atoms of the benzene rings and also highlight them with a background color
v = mol.draw2d()
C2_atoms = mol.get_atoms("C2", by="id", filter=lambda a: a.parent.name == "PRP")
v.label_atoms(
{atom : "C-target" for atom in C2_atoms}
)
v.highlight_atoms(C2_atoms, color="cyan", radius=0.5)
v.draw()
[35]:
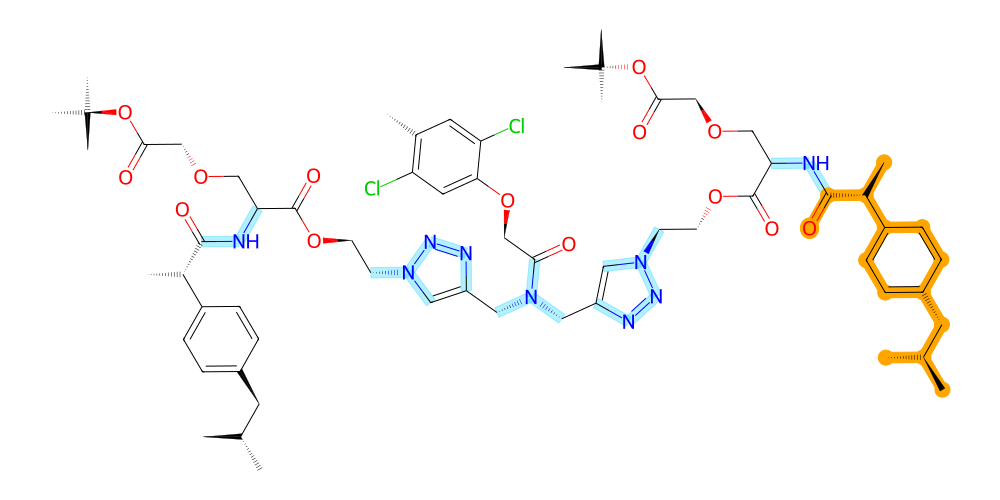
In the same way we can highlight bonds or entire residues like so:
[15]:
v = mol.draw2d()
# highlight the entire residue with serial number 1 in orange
v.highlight_residues(1, color="orange")
# highlight all bonds with nitrogen atoms in an opaque blue (using RGB with alpha channel)
v.highlight_bonds(mol.get_bonds(mol.get_atoms("N", by="element")), color=(0, 0.8, 1, 0.3))
v.draw()
[15]:
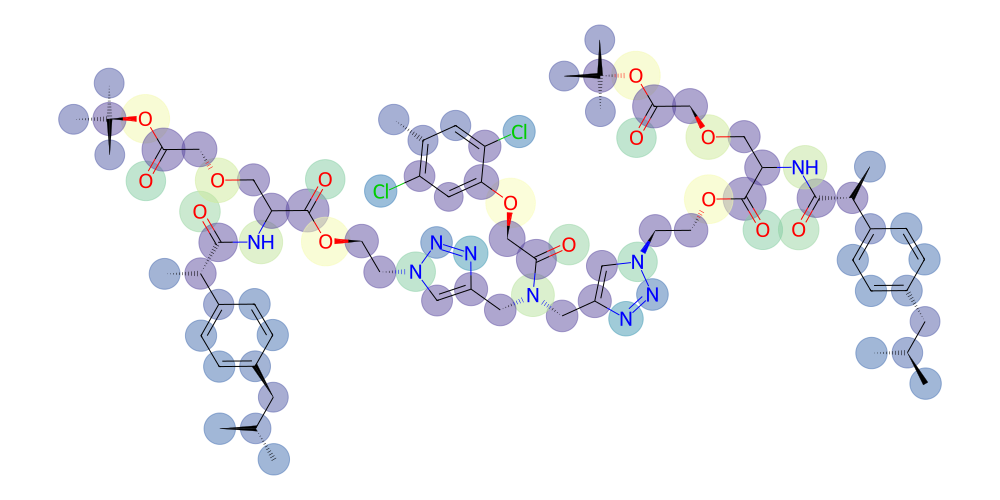
The color argument of highlight_atoms and highlight_bonds also supports functions to dynamically assign colors based on other atomic properties.
[ ]:
# compute electrostatic potential using rdkit
from rdkit.Chem import AllChem
rdkit_mol = mol.to_rdkit()
AllChem.ComputeGasteigerCharges(rdkit_mol)
for atom in mol.atoms:
atom.charge = float(rdkit_mol.GetAtomWithIdx(atom.serial_number-1).GetProp("_GasteigerCharge"))
# visualize the charges as a color gradient
import matplotlib.pyplot as plt
norm = plt.Normalize(-0.5, 0.5)
cmap = plt.get_cmap("Spectral")
v = mol.draw2d()
v.highlight_atoms(
mol.atoms,
color=lambda a: cmap(norm((a.charge or 0) + 0.5), alpha=0.5), # use the charge to determine the color...
radius=lambda a: 0.6 + 0.9 * abs((a.charge or 0)), # same for radius...
)
# draw with transparent background
v.draw(background=None)
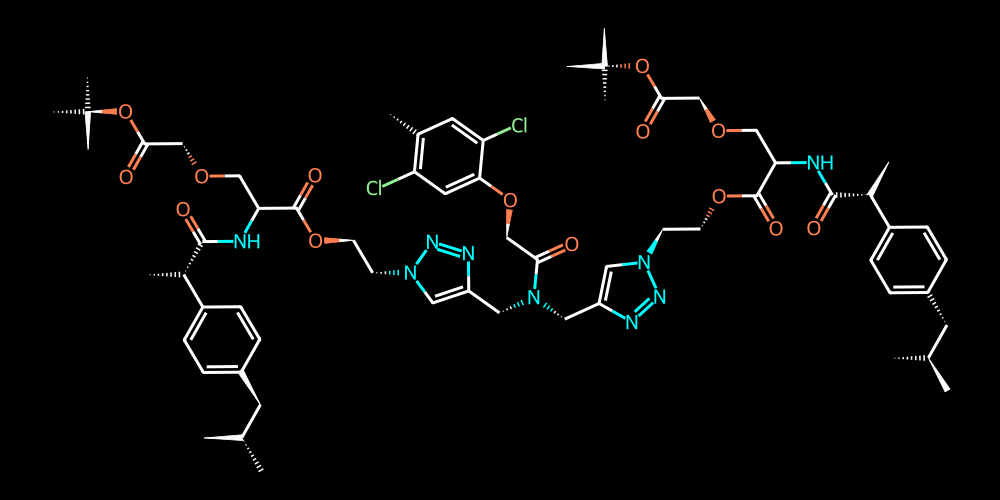
If we are interested in presenting our molecule white-on-black we can adjust the background color and color palette like so:
[18]:
# adjust the color palette for atoms (rgba or named colors are supported)
v = mol.draw2d()
v.set_colors({
"C" : "white",
"N" : "cyan",
"O" : "coral",
"Cl" : "lightgreen",
})
# and specify the background color as black (also increase linewidth for better visibility)
v.draw(background="black", linewidth=3)
[18]:
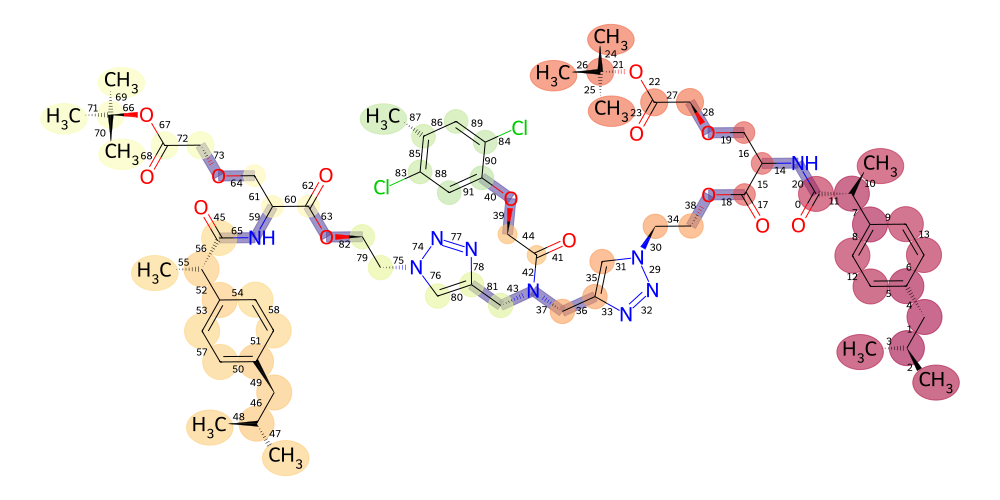
Lastly, anything that we have not covered yet we can pass as **kwargs to the draw method and it will get passed into the MolDrawOptions to tune the visualization further (see rdkit docs on MolDrawOptions for reference):
[51]:
v = mol.draw2d()
v.highlight_atoms(
mol.get_atoms("C", by="element"),
color=lambda a: cmap(norm(a.serial_number) / 250, alpha=0.6),
radius=lambda a: 0.3 + 0.7 * (a.parent.count_atoms()) / 50,
)
v.highlight_bonds(
mol.get_residue_connections(),
color=lambda b: cmap(norm(b[0].mass + b[1].mass) / 10, alpha=0.6),
)
v.draw(
# faithfully pass kwargs to MolDrawOptions
explicitMethyl=True,
addBondIndices=True,
)
[51]:
And that’s it for this tutorial! We have seen that BuildAMol provides a flexible suite to create custom and detailed 3D and 2D visualizations of molecular structures. Looking at structures often gives very helpful cues during the building process so it’s a valuable skill to be able to make visualizations that show the right information in the right way! With that said, thanks for checking out this tutorial and good luck with your project using BuildAMol!